
Testing and Debugging State Machines
Introduction
Section titled “Introduction”Any non-trivial software must be tested. In testing, errors are detected and corrected — this process is known in software development as debugging. A program may have two kinds of errors: coding and application failures. Obvious coding errors manifest themselves by crashing the program or other programs and, in the worst case, the operating system. Several not-so-obvious coding errors result in misbehavior of the application, “simulating” in a way logical errors. A notorious example of such a failure is the unfortunate comparison operator == used in C / C++, which often stays undetected by a compiler if confused with the assignment operator =. I would like to have money corresponding to the time invested in searching for this kind of simple error. Application errors mean that the program does not realize the requirements. Hence, the reasons for application errors are very often not clear – they can be logical errors or coding failures.
Classical debugging is done in a program, which means that we are trying to find the erroneous code and correct it. Such debugging is not easy as the two aspects, code and application errors, are overlaid.
In StateWORKS, debugging is clearer — in principle, we are looking for application errors. The probability of a coding error is extremely low as the application is built using very robust, standard code (RTDB), which has been used and tested over many years in a variety of applications. Of course, nobody can guarantee 100% reliable code, but if the failure is really in the RTDB, it must be corrected by the manufacturer of StateWORKS.
Testing state machine applications
Section titled “Testing state machine applications”For the user, debugging of the RTDB-based application means testing whether the system of state machines works properly. Testing a state machine may be tricky. To facilitate testing, a few things must be available, such as: a trace facility, a debugging mode, automation of test sequences, and a service mode. Good, up-to-date documentation has to round up the development environment.
Stages of software testing
Section titled “Stages of software testing”Any program must be checked against the requirements. There are several stages of testing while developing software: testing while programming, verification, testing of ready programs, and customer use.
Coding is an error-prone task. Therefore, a program has to be tested continuously during its development phase. Testing is an integral part of coding. The development tools prove the correctness of syntax (compiler) and the completeness of required software modules (linker). Before the program is completely ready, a programmer begins to run the already created code, trying to catch logical errors and deviations from the requirements. In some cases, it is the way to complete the specification with missing details. In extreme cases, the working program shows the programmer what he really wanted to program.
If the software is designed before coding, using some formal methods, there is a chance to verify the model which lies behind the software. Normally, there is no model of the entire software, but only some parts can be verified. As a rule, the verifying process is applied to the control paths of the software, which can be modelled, for instance, using finite state machines. The verification process is able to detect some logical failures in the design, as, for instance: deadlocks, infinite loops, not reachable states, improper terminations, etc. The verification process is done already in the design phase. Of course, coding may corrupt the model; hence, the process should be applied again to the completed program if possible. Verification of software models belongs to a class of rather overvalued activities, but it is popular because it is feasible. Unfortunately, software verification is not able to catch logical errors in software (finite state machine) specifications which lead to failure in conformance to requirements.
The answer to the last problem can be achieved by testing a running program. Testing means here a repetition of stimuli which are expected while the software is in use and a comparison of responses with the expected values. The obvious scenarios are, for instance, the UML Use Cases which represent the “sunny days scenarios” (when everything works as expected). A true testing process has to simulate also the unexpected situations which may occur infrequently but could have disastrous effects if the software fails. We are not able to cover all imaginable situations, but we have to invent as many testing scenarios as possible. The testing scenarios play an extremely important role in software changes. A changed program is normally tested against the expected effects. Unfortunately, any changes to a program can have side effects which are unpredictable. Therefore, after all changes, we should repeat most, if not all, testing scenarios which may detect those side effects.
The last software testers are customers. While using the software, they create situations which are never expected by professional testers and programmers. Customer feedback is valuable for software developers, allowing them to improve the software quality and tune it to the real challenge. An automated request to send a message to Microsoft while the Windows operating program breaks down or encounters a problem is a well-known example of this kind of feedback.
System Consistency
Section titled “System Consistency”Debugging of the RTDB application begins with a start-up during which a sulog.txt file is produced. This file is a log file with a list of objects that could not be built due to some inconsistencies in the system specification .swd file. The inconsistencies are allowed on purpose in StateWORKS to test not-quite-ready applications. Of course, the ultimate application should produce an empty log file.
The following example shows a sulog.txt file:
VFSM System Startup Log-----------------------Config File: G:\StateWORKS\Projects\Test\SurfaceView3\SWSystem\Spec\SWSystem.swdStartup Time: 14-Jan-04 09:29:18
W1      4   Not found enumeration in/or IOD-File: joystickdigital       X:JoystickDigital:CmdW4      27  String Resource not found: IDS_AL_START_ERROR               Axes:Al:Motor_Start_ProblemW135    8   Not found User Defined OutFunction OfuCheckDeviceNumber     Allsens:OFun:CheckDeviceNumber
There are:    3 Warning(s)
In a rather cryptic form, it contains 3 warnings signaling missing:
- Cmd names list
- Missing string for an alarm text
- Missing output function.
The number in the second column (4, 27, 8) is an error / warning type – in all, there are 30 types of them.
Trace means the availability to record all or selected steps performed by a program. All RTDB objects have the trace facility, which may be activated or disabled. Normally, the trace facility is disabled. If activated, the trace facility causes all changes of object states (and for some objects also their data values) to be logged into a trace.txt file. Trace can be activated from Monitors by setting the Trace flag of an object to true (1). Any number of objects may be traced simultaneously. In addition, the trace.txt file can be closed and opened again at any time from Monitors. After re-opening, the trace file is always empty. A line in a trace file shows:
- the time of the event
- the object type
- the object name
- the numerical value of the object state
- the name of the object state (if available)
- the data value (if appropriate).
An example of a trace:
VFSM System Trace File----------------------(Date: 18-Oct-04 21:57:22)21:57:29 CMD Main:Cmd 021:57:29 CMD Pressure1:MyCmd 1 Cmd_Start21:57:29 VFSM Pressure:01 3 Starting21:57:29 CMD Pressure1:MyCmd 021:57:29 TI Pressure1:Ti:Timer 3 RUN21:57:29 NO Pressure1:No:SetPressure 3 CHANGED 90021:57:29 NO Pressure1:No:SetPressure 5 SET 90021:57:29 OFUN Pressure1:Ofun:ActualPressure_CalcLimit 121:57:35 SWIP Pressure1:Swip:ActualPressure_Supervision 3 IN21:57:35 TI Pressure1:Ti:Timer 2 STOP21:57:35 VFSM Pressure:01 4 RegulatingFor instance, at 21:57:29, the object NO with the name Pressure1:No:SetPressure changed its state to SET (5) because its value had been set to 900. A zero value for a CMD object means that no command is active: other values will usually have names assigned.
The trace illustrates well the events in the state machine Pressure1: it received the Cmd_Start and went into the state Starting (3), where the following entry actions were performed: the Cmd was cancelled, the Timer started, the Numerical Output set to 900 (two entries because NO data was changed and set as output), and the Output Function was called to calculate the switchpoint limits — the operation was successful, which was signaled by the return value 1. 6 seconds later, the SWIP object had signaled with its IN state that the input pressure was within limits, which forced the state machine to go to the state Regulating. Before it left the state Starting, it had stopped the Timer.
The trace “description” corresponds, of course, exactly to the state machine specification.
Debugging mode (VFSM)
Section titled “Debugging mode (VFSM)”Probably the most difficult requirement is to test state machines “slowly”, step by step. A state machine or, even worse, a system of state machines may have loops. A loop in a state machine means that a state machine performs several state changes and / or input actions in response to a single stimulus (condition change). The changes are too fast to be noticed by a human being. For a coded implementation, we could debug the code using a debugger step mode. A similar possibility is available in the StateWORKS development environment.
A step in the StateWORKS execution environment means performing one state transition (with appropriate actions) and / or those input actions specified in a present state. The use of the step mode is especially easy in SWMon, where a state machine has 3 radio buttons to control the step mode: Run, Hold, and Step. Of course, we can control the step mode from other monitors by setting the Rmo (Run Mode) and NSt (Next Step) attributes.
If the Run radio button is chosen (default), as in Figure 1, the state machine runs and the “Next” box to the right of the radio buttons displays -/none: no input actions and no transition.

Figure 1: SWMon - VFSM Pressure1 is in the Run mode
Selecting the Hold radio button, as in Figure 2, stops the execution of the VFSM Executor, but the next state is displayed in the frame to the right of the buttons. In the example below, the next state is Starting. 1

Figure 2: SWMon - VFSM Pressure1 is in the Hold mode
Selecting the Step radio button forces the VFSM executor to perform one step — in the example, the transition to the state Starting (Figure 3 shows the SWMon display after the step). The system returns to the Hold mode and waits for the next step. In the example, the next step means a transition to the state Regulating.

Figure 3: SWMon - VFSM Pressure1 has executed one step
If we wait until the timer expires, the “Next” box changes and signals now that there are input actions and a transition to the state Idle to be done (Figure 4). We see that all changes of the inputs are observed in the Hold mode — the next actions or transition correspond always to the actual input situation.

Figure 4: SWMon - VFSM Pressure1 has executed one step and the timer expired
After the second step, the Alarm is generated (it was the announced input action) and the Pressure1 state machine goes to the state Idle. There are no actions or transitions due at this moment.

Figure 5: SWMon - VFSM Pressure1 has executed the second step
If there are no input actions or transitions due, and we perfom a step, the Step radio button gets/stays checked and the VFSM Executor will perform the actions or transition if the corresponding condition becomes true.

Figure 6: SWMon - VFSM Pressure1 has no input actions or transitions due
Testing with StateWORKS Monitors
Section titled “Testing with StateWORKS Monitors”StateWORKS specification tools and RTDB-based run-time systems offer effective means for testing programs being developed as well as running applications. As the StateWORKS concept is based on finite state machines (VFSM), testing concentrates on running scenarios which check the correctness of state sequences. In addition, the specific nature of RTDB-based applications allows easy access to all objects (variables, data) which can be checked against expected values. Monitors are used for testing.
The SWMon is the basic monitor used for manual testing. It displays all object properties in several forms (state machine, I/O-unit or user defined). Due to its presentation variety and simultaneous display of selected objects, SWMon is especially useful in the development phase for solving difficult state machine specification problems. Its very strong point is the ease of using a service (force) mode and logical debugging using step mode while executing finite state machines.
SWQuickPro is the most powerful tool considering automatic testing. Testing of an RTDB-based application is understood as sending a stimulus to an object (for instance, a command to a finite state machine), waiting a while, reading a value from the RTDB, and comparing it with the expected value. If the comparison delivers a false result, an error is written into a log file. The sequence is repeated many times, whereas the delays between commands can be defined in the command file. Optionally, a wait for an event can be used as a break in the command sequence instead of a fixed time delay.
SWQuickPro
Section titled “SWQuickPro”The SWQuickPro monitor is a Windows dialog application; its graphical user interface (GUI) is shown in Figure 7. The GUI contains 3 zones: connecting, monitoring, and testing.
Connecting to RTDB
Section titled “Connecting to RTDB”The upper part is the connecting part. The buttons Connect and Disconnect are used to connect / disconnect the SWQuickPro to / from an RTDB-based application whose IP address is defined in the textbox Host and Port. If required, the textbox Password is used for entering the password.
The state of the connection, the application configuration file, and some basic information about the application (number of objects and number of state machines) is displayed in rows below the buttons.
Monitoring functions
Section titled “Monitoring functions”The middle part is the Monitoring part. If connected, SWQuickPro displays a list of RTDB objects on the left side. On selecting an object in the list, all attributes of that object are displayed to its right.
- A click on the button Get displays the object attribute value for the selected attribute or all attribute values if the pseudo attribute
.allis marked. - A click on the button Set writes the value (entered into the textbox to its right) into the selected object attribute (the pseudo attribute
alldoes not make sense in that case).
Only those buttons are enabled which can be used for a selected attribute. The button Set is, of course, disabled for the pseudo attribute .all.
Logging
Section titled “Logging”The bottom part is the Testing part that contains several elements for handling tests. All communication with the RTDB (Get and Set operations done in the monitoring part) is written automatically into a log file SecurityLamp.log where SecurityLamp is the configuration file name (file *.swd). The default directory of the log file equals the application configuration file directory and cannot be changed.
Creating a test file
Section titled “Creating a test file”The log file can be copied into the command file using the button Save to Test File. The default name of the command file SecurityLamp.swc can be redefined in the textbox Test File.
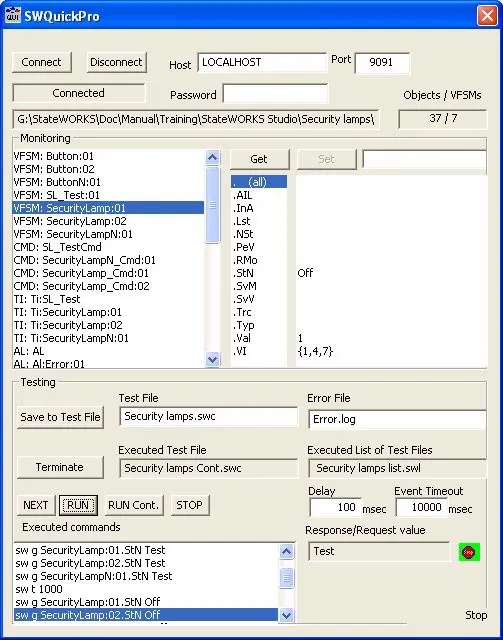
Figure 7: SWQuickPro Monitor
By saving the log file to the test file, we get a choice of overwriting the existing command file or appending the log file content to the test file (see Figure 8). If the test file does not exist, it will be created.
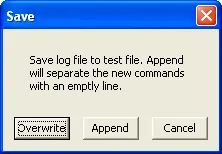
Figure 8: Save dialog
Command files
Section titled “Command files”Testing of the application is normally a long process. Using StateWORKS Studio, we are testing from very early in the project. Testing means a repetition of different scenarios. This procedure is tiresome and requires automation by means of command files.
The command files created from log files can be used for simple testing or exercises, but a true, demanding, tailored-to-our-needs command file has to be written by hand. The log file may, of course, be the initial file where we sort out the redundant commands and add pseudo commands to achieve proper timing.
While creating a command file for automatic testing, we use the commands defined for communication with the RTDB, especially the Set and Get commands:
sw s objectname[attributename] Valuesw g objectname[attributename] ExpectedValueThese commands have been completed by two pseudo commands sw t and sw e, which are used for defining waiting time between commands sent to the RTDB.
Command Delay
Section titled “Command Delay”sw t DelayValuesw t ObjectName.AttributeNameThe sw t (delay) command has a parameter which can be:
DelayValue, which is an integer defining a delay in msec.ObjectName.AttributeName, which is the name of an RTDB object which defines a delay. Normally, this object will be a timeout of a certain timer.
For instance:
// define 5000 msec pause before next command will be performedsw t 5000
// define pause which equals timeout value of timer Ti:SecurityLamp:02// (In that case timer clock base will be considered to define proper value in msec)sw t Ti:SecurityLamp:02.CnC
Command Wait for Event
Section titled “Command Wait for Event”sw e ObjectName.AttributeName Value [DelayValue]The sw e (wait for event) command may have up to three parameters:
ObjectName.AttributeNameis the name of an RTDB object that defines an event to be waited for. Typically, this object is a state machine (VFSM) and its attribute is the state name (.StN).Valueis the event to be waited for.DelayValueis an optional parameter (integer) that defines the timeout (in msec) for the event.
For instance:
// wait for state Off of state machine SecurityLamp:01 or continue after 2000 msecsw e SecurityLamp:01.StN Off 2000If the parameter DelayValue is missing, an EventTimeout value (default = 10000 msec) is taken.
Using command files for automatic testing
Section titled “Using command files for automatic testing”A button Terminate in Figure 7 has a double function. In the initial state, it is named Load test file and is used to begin the test by loading the test file. In the initial state, a click on this button opens an “open file dialog”. Either a single command file (extension *.swc) or a file containing a list of command files (extension *.swl) can be selected. While running a test, this button is named Terminate and is used to terminate the test and return to the initial state, accompanied by clearing all relevant UI controls.
The errors occurring during the test are written into the error file with the default name Error.log. The name of the error file can be changed in the textbox Error File. The default directory of the error file equals the application configuration file directory and cannot be changed. An example of an error file is shown in the Appendix A.03.
A click on the button NEXT performs one command from the selected command file. The just-executed command is displayed as selected in the listbox Executed commands. The executed command parameter of the Set operation is shown in the textbox Response/Request value. The same textbox displays the response for the Get command. If the response differs from the expected response, an error icon will be displayed to the right of the textbox Response/Request Value.
While executing a single test file, the commands as shown in the Executed commands listbox are executed sequentially. Reaching the end of the list, the execution begins again from the first command in the list. While performing a continuous test (buttons RUN or Run Cont.), the execution returns to the beginning of the list, but stops at the first command and has to be restarted.
A click on the button RUN starts a continuous execution of a command file. The delay between two consecutive commands is determined by a default value defined in the textbox Delay. This value can be redefined at any time. The delay between two consecutive commands is replaced by the command sw t in the command file. If an error occurs, the testing is stopped. Testing can be resumed by pushing a button: NEXT, RUN, or RUN Cont. Similarly, the default value of the event timeout is replaced by a parameter of the command sw e. The default value of the event timeout is displayed and can be redefined at any time in the textbox Event Timeout.
Similarly, a click on the button RUN Cont. starts a continuous execution of a command file. In that case, a test error does not stop testing.
A click on the button STOP stops continuous testing, which can be resumed by pushing a button: NEXT, RUN, or RUN Cont.
A click on the button Terminate terminates testing.
If running a list of command files (.swl), all command files in the list are processed sequentially. The Appendices contain examples of a command file and a list of command files.
Service mode
Section titled “Service mode”While testing, we like to have a possibility for simulating values which influence a control. This feature, called Service or Force mode, is especially important for external input signals. StateWORKS provides a Service mode for all external I/O objects: DI, DO, NI (represented by SWIP), and NO. Additionally, the internal I/O objects CMD and VFSM can also run in service mode to allow us to debug the Master – Slave interface.
Figure 9 shows details of a service mode for DI — it allows us to test the system without its hardware digital inputs. The default mode is the Auto mode, which means the DI values are coming from the I/O Unit, effectively from the hardware. The Peripheral Value (PeV) comes from the hardware via the IO-Unit and is passed in Auto mode (SvM = false) to Val stored in RTDB. In Service mode (SvM = true), Val gets the service value SvV set in Monitor.

Figure 9: Service mode for DI object
The service mode for other objects functions similarly.
The role of documentation
Section titled “The role of documentation”The software documentation is the only information source for several groups within the company producing the product:
- to plan the testing, a good overview of the software is required,
- the product test team must create the test plans,
- customer documentation must be written,
- product support and maintenance need detailed information, and
- further product development cannot count on information stored as code.
Because of this, complete and up-to-date software documentation shall be a key requirement for all software manufacturers. The creation of this documentation has to start as soon as possible to ensure that all other tasks, like test plans or customer documentation, will be completed in good time. During debugging, several aspects of a design will change: state machines, the object properties, the command files. These changes influence other software documents produced by cooperating teams.
The entire content of the StateWORKS application: the configuration of a system of state machines, state transition diagrams, and state transition tables are available as JPG or WMF files. All information is also produced in XML documents.
As in StateWORKS any change in state machine behavior can be done only “officially” in the StateWORKS Studio, the documentation is always up-to-date. There is no way to corrupt the documentation as it is an inherent part of the development system, always reflecting the actual state of the application being developed. To sum it up, in StateWORKS the distance to the updated documentation is very short — just one click.
Conclusion
Section titled “Conclusion”The testing and debugging facilities for applications built around the RTDB stem from the principle of using a ready run-time system. The standard access to all relevant data concentrated in the RTDB, plus the control model based on finite state machines, allows the definition of a standard test procedure and corresponding tools like SWQuickPro which have universal character. They can be used in any RTDB-based application specified with StateWORKS Studio.
These debugging features accelerate the development and allow us to call the StateWORKS specification an executable specification, whose characteristics are taken over directly to the final implementation.
Appendix
Section titled “Appendix”A.01 Example of a command file
Section titled “A.01 Example of a command file”// Test of Security lamps
// Start testsw s SL_TestCmd.PeV 1
// Read states of all state machinessw g SecurityLamp:01.StN Testsw g SecurityLamp:02.StN Testsw g SecurityLampN:01.StN Test
// Break for 3 secsw t 3000
// Wait for SecurityLamp:01.StN being in the state Off// otherwise timeout after 1 sec// Check whether the state machine is in the state Offsw e SecurityLamp:01.StN Off 1000sw g SecurityLamp:01.StN Off
// Wait for SecurityLamp:02.StN being in the state Off// Check whether the state machine is in the state Offsw e SecurityLamp:02.StN Offsw g SecurityLamp:02.StN Off
// Check whether the state machine is in the state Offsw g SecurityLampN:01.StN OffA.02 Example of a list of command files
Section titled “A.02 Example of a list of command files”// List of Security lamps testsSecurity lamps.swcSecurity lamps Cont.swcSecurity lampsE.swcA.03 Example of an error file
Section titled “A.03 Example of an error file”G:\StateWORKS\Doc\Manual\Training\StateWORKS Studio\Security lamps\Conf\Security lamps list.swlstarted at 30-May-07 11:30:00
G:\StateWORKS\Doc\Manual\Training\StateWORKS Studio\Security lamps\Conf\Security lamps1.swcstarted at 30-May-07 11:30:00End of test
G:\StateWORKS\Doc\Manual\Training\StateWORKS Studio\Security lamps\Conf\Security lamps Cont.swcstarted at 30-May-07 11:30:35 Line 6: g SecurityLamp:01.StN Off : Test <> Off (expected) Line 7: g SecurityLamp:02.StN Off : Test <> Off (expected) Line 8: g SecurityLampN:01.StN Off : Test <> Off (expected)End of test
G:\StateWORKS\Doc\Manual\Training\StateWORKS Studio\Security lamps\Conf\Security lampsE.swcstarted at 30-May-07 11:30:37 Line 8: Timeout while waiting for event: SecurityLamp:02.StN OffEnd of test
End of testFootnotes
Section titled “Footnotes”-
Note that after changing to Hold, we also fulfilled afterwards the required transition condition by sending
Cmd_Startto the system in order to show the next state. ↩